Explore Excel's Advanced Chart Types

Charts in Excel 365 had an update!
Did you know there are now a few more options available to users? Because spreadsheets aren’t just about raw data! Sometimes it’s easier to read and understand data if we see it in a graphical format. That’s where charts come in. The problem with chart types originates with deciding which type of chart to use for what situation or data type. When would you use these types of charts?
Chart Type & Data Usage
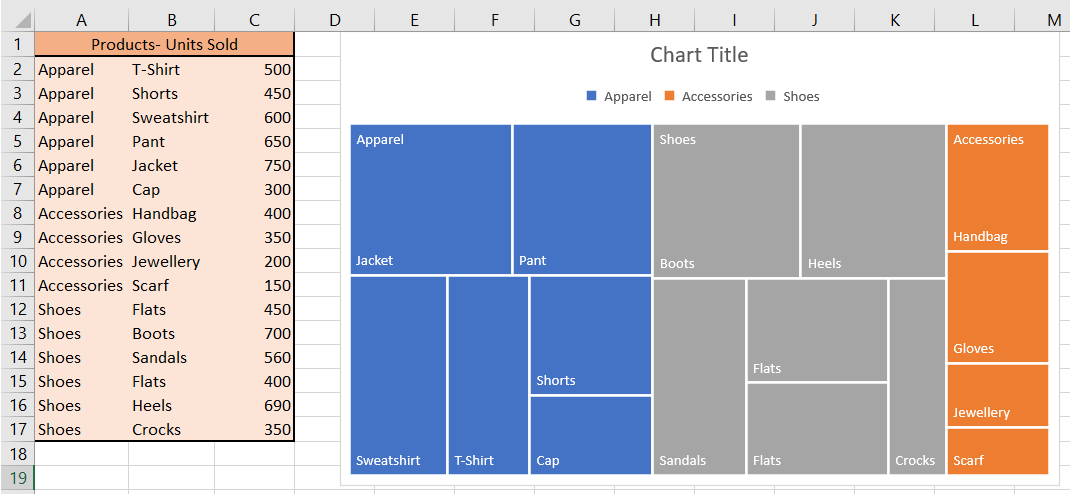
Treemap
Hierarchical to pinpoint data patterns
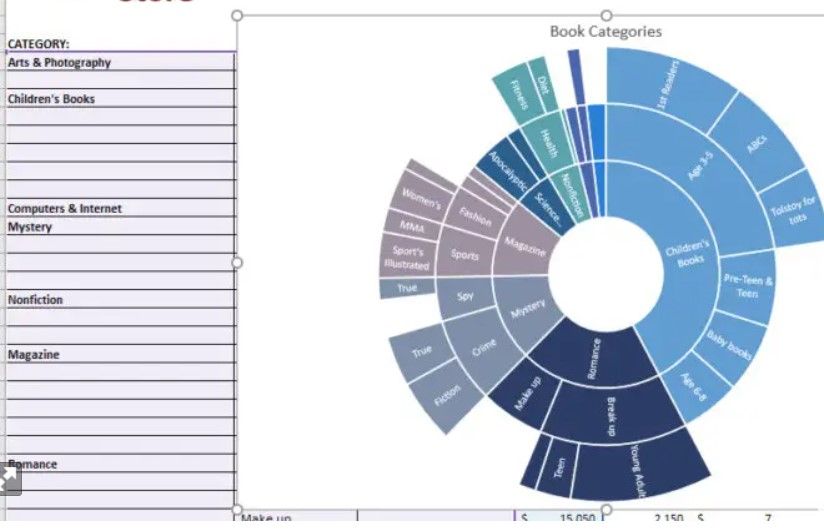
Sunburst
Relationships between categories & sub-categories
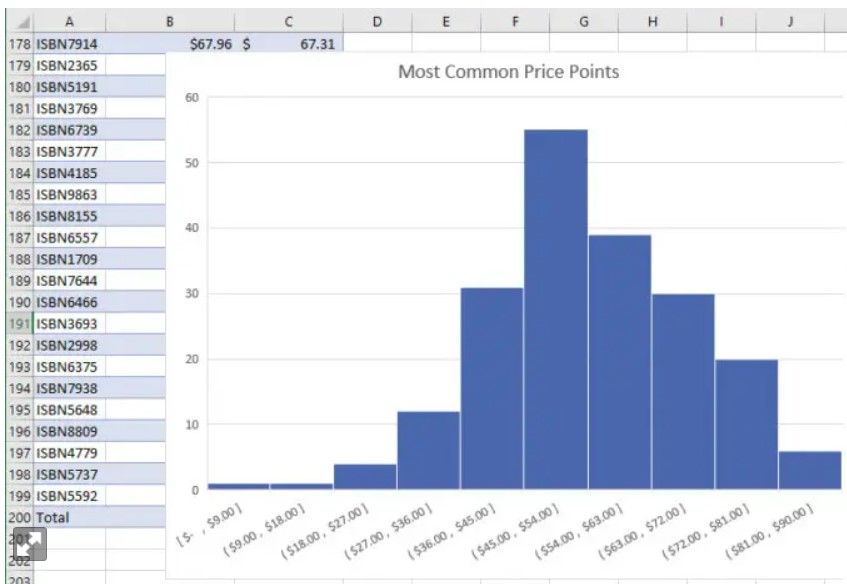
Histogram
Statistics
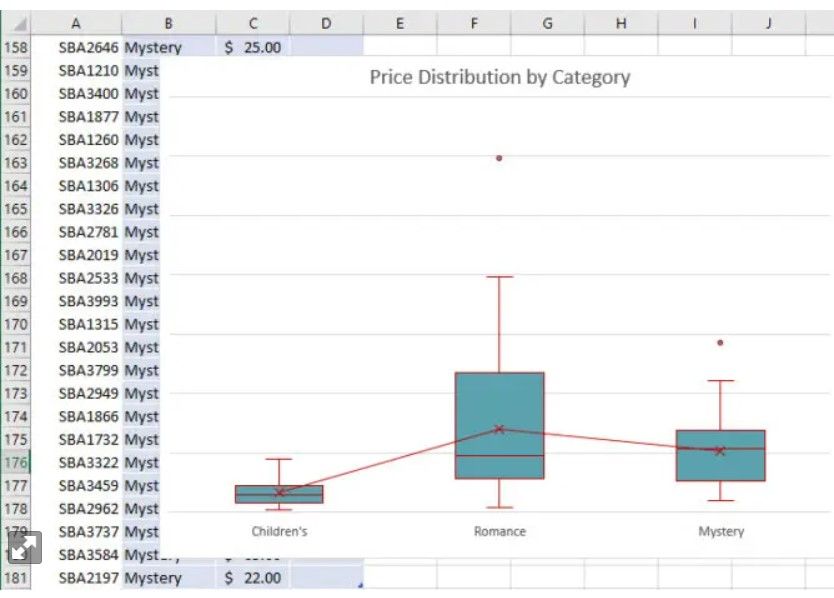
Box & Whisker
Shows distribution of data into quartiles, highlighting the mean and outliers
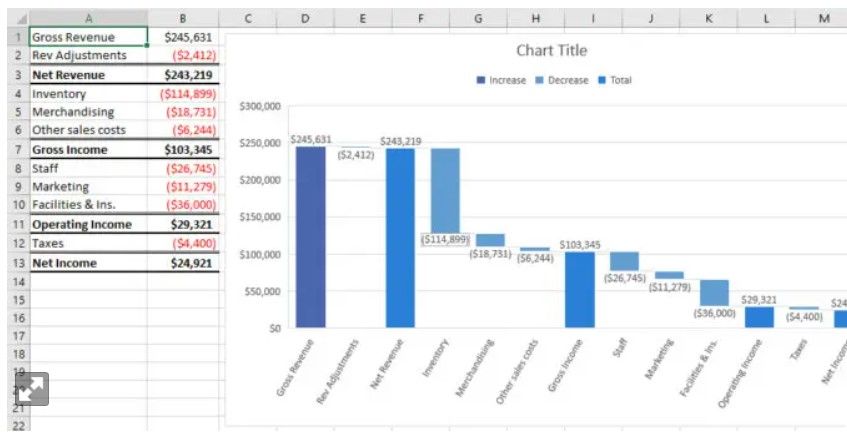
Waterfall
Financials & totals
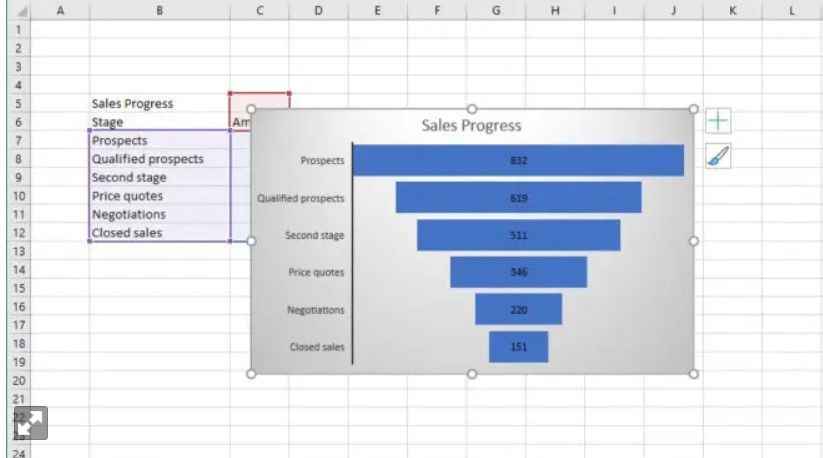
Funnel
Displays values at multiple stages in a process.
How they Look
Treemap
Sunburst
Histogram
Box & Whisker
Waterfall
Funnel
Charts are available in Western Training Solutions, Excel Level 1 where you will be instructed on how to create charts using existing data. Contact sales@westernts.ca or call or text 204-8374776 to get more information.