Power Bi

What is Power BI?
Power Bi allows you to take unrelated data sources and make them visually immersive, and interactive. Imagine taking Excel spreadsheets, cloud-based data, and on-premises data and viewing them all together in an interactive experience! Power Bi easily allows you to connect data sources, visualize and discover relationships in your data, what’s important in your data; and then share it with anyone you want! Pretty cool, no?!
The three parts of Power Bi
There are several elements to Power Bi – however, we start with the basic three:
- Power BI Desktop (Windows) application.
- Software available online as a service called (SaaS) the Power BI service.
- Power BI Mobile apps for Windows, iOS, and Android devices.
These three elements are designed to let you create, share, and utilize business insights.
How does your role match up with Power Bi?
Using Power Bi depends directly on your specific role in your project or team. The way you use Power Bi may vary from others you work with depending on their specific roles and responsibilities.
The flow of work in Power Bi
For the most part, workflow in Power Bi begins by connecting to data sources in Power Bi Desktop and building a report from there. That report subsequently gets published from the Power Bi Desktop to the Power Bi Service, and then it can be shared so business users in the Power Bi service and mobile apps can view and interact with the report. Workflow is common and really illustrates how the three main Power Bi elements complement each other.
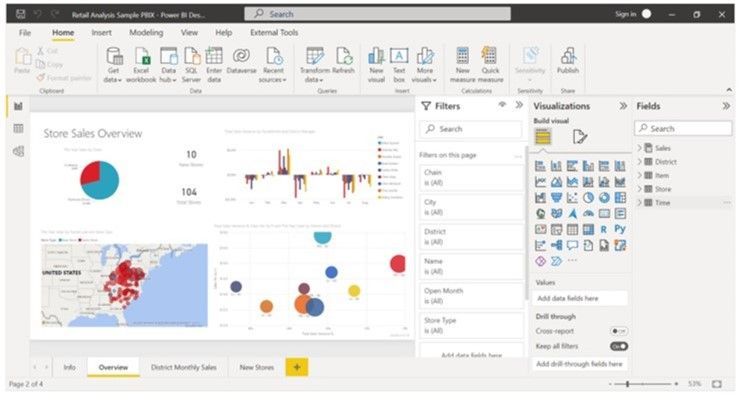
What is the Power Bi Desktop?
First and foremost, Power Bi Desktop is a FREE application you install on your local computer that permits you to connect to multiple data sources, transform, and visualize your data. When you combine multiple data sources we call that “data modeling”. The data model allows you to build visuals, as well as collections of visuals that you can share as reports with others inside your organization.
Common uses for Power Bi:
· Connect to data
· Transform and clean data so you can create a data model.
· Create visuals – Charts which provide a graphical (pictorial) representation of data (A picture is worth a thousand words!)
· Create reports representing collections of visuals into one or more report pages.
· Sharing reports with others in your organization using Power Bi services.
Who uses Power Bi?
If your title happens to be “Data Analyst” or “Report Creator” your responsibilities may include using the tools provided in Power Bi. While it isn’t necessary to have a job title as mentioned above – many people in industry, and business utilize the tools provided in the Power Bi world to create data models and shar the reports the create with their coworkers and their organizations. If your position requires you to work with multiple data sets and sources Power Bi may be the answer you’ve been looking for.
Contact sales@westernts.ca or call or text to get more information on this exciting data modeling tool that can make your life easier!